Basic survey data
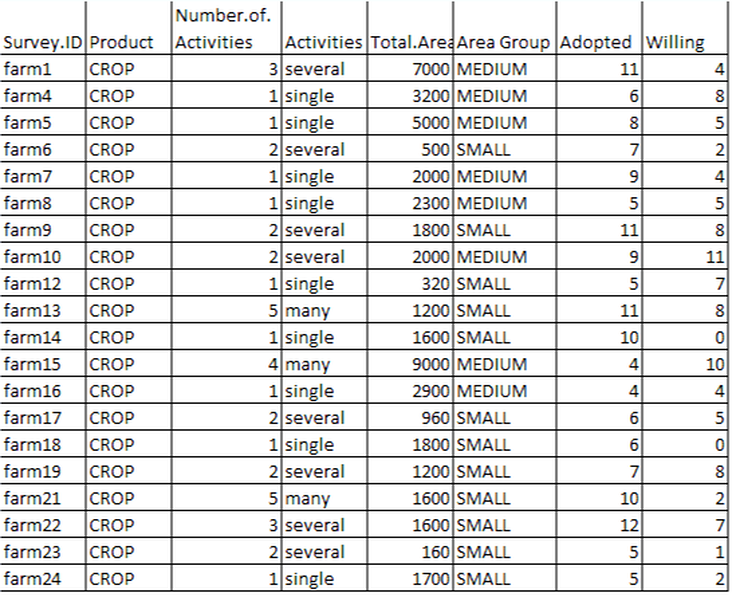
I used both raw and aggregated data from the survey results. The sampling units for this survey were individual farmers who responded. They are identified in the Survey ID column. I used Product and Total Area to categorize farms (Table 1). The Product represents the main type of farming activity for each farm, and the Total Area is represented in acres and reflects owned and rented land used in the operation. I also used the individual responses to determine how many different types of farming activities were occurring on each farm. I used a bar plot to view the proportion of Beef farmers to Crop farmers (Graph 1), and a density plot to view the size distribution of farms (Graph 2).
Table 1- Farm Basic Info
|
Graph 1 - Proportion of Farms by Product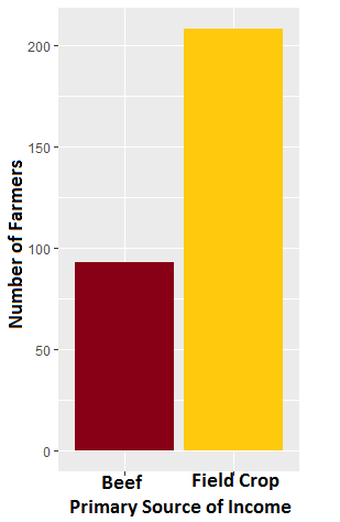
|
Graph 2 - Total Area Distribution by Product
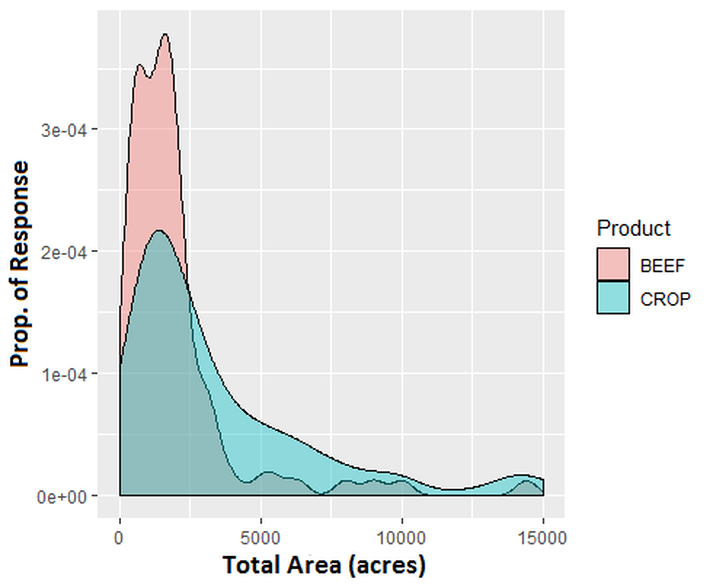
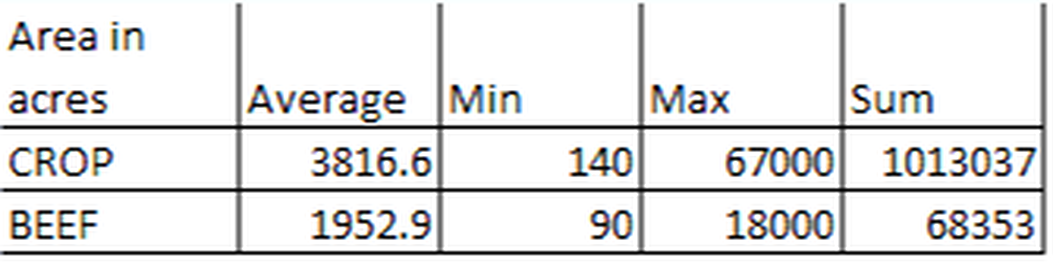
The preliminary graphs showed that the survey primarily included approximately 1/3 beef farmers and 2/3 crop farmers, as requested from the survey collection company. Furthermore, Table 2 shows that on average crop farms are noticeably larger than beef farms in our sample, and while the range is also greater, the smallest crop farm is still larger than the smallest beef farm.
Table 2 - Farm Area Basic Statistics
For Value and Practice/Project Data, please view the designated sub-pages.
