The Results!
I compared the two most highly ranked environmental values (soil and water quality) against the practices that are closely related to these values (Zero Till, Maintaining Wetlands, Leaving Residue on Field, and Planting Nitrogen-Binding Pasture Cover).
After analyzing the relationships based on the proportions of responses, I used the chi-square test for proportion on each of the sub-tables below to check the significance of the results. I created contingency tables measuring the rate of response to the Value questions against the rate of response to the practice adoption questions. The proportions of practice~value data are shown in Tables 6 and 7. Both the value data and the practice data were categorical, as each response represented a specific answer. By calculating proportions in a contingency table, the data was made suitable for the chi-square test.
The brightest yellow p-values represent the most significant results. These were observed for valuing soil quality and the practice of maintaining wetlands, as well as valuing water quality and leaving residue on the field. These results are counter-intuitive, because wetlands would appear more closely related to water quality, whereas leaving residue on the field would be more intuitively linked to soil. Closer analysis of these results and practices may explain these findings.
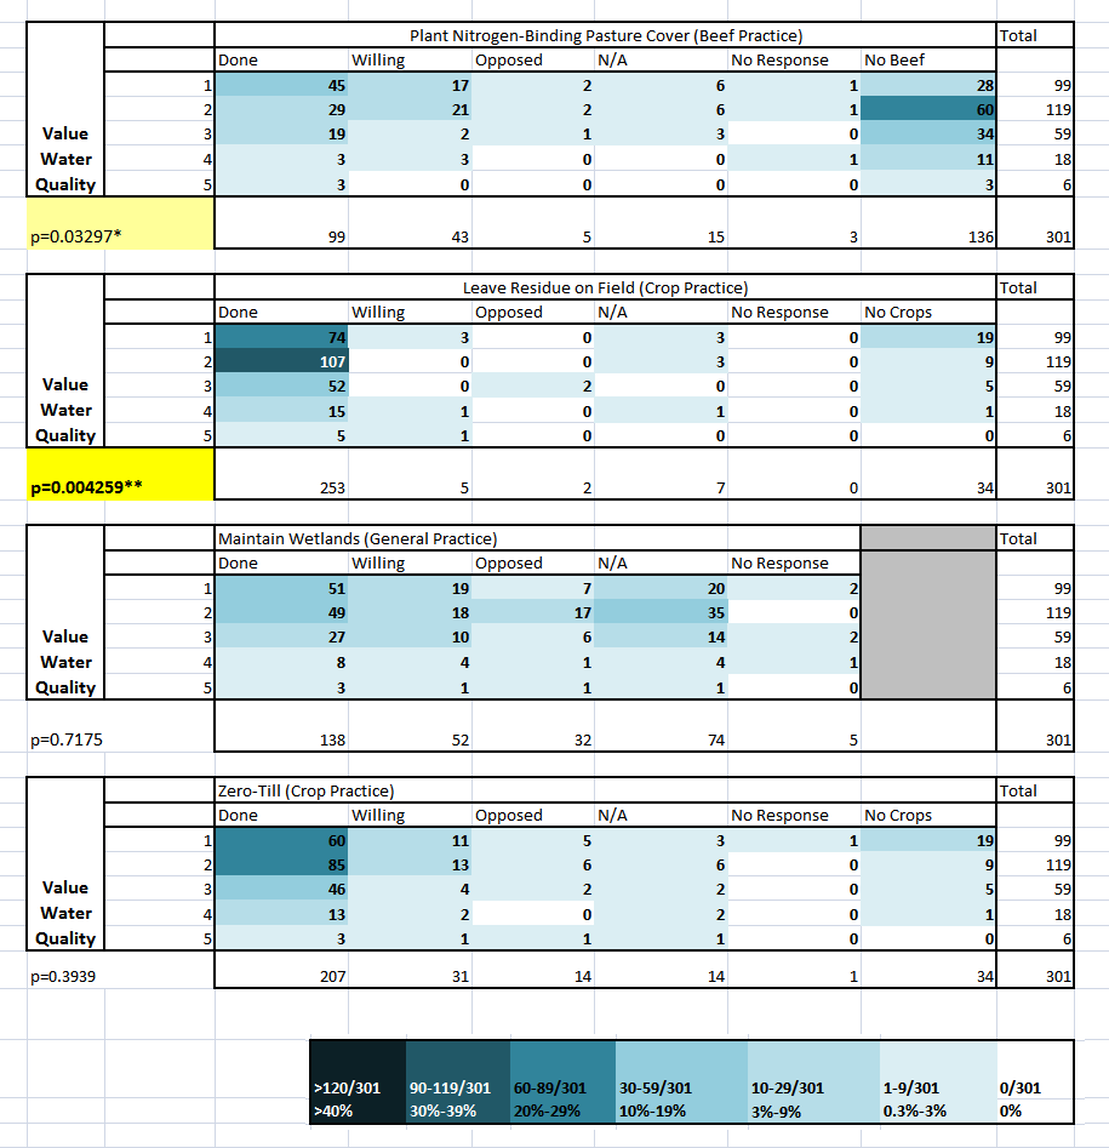
Table 6 - Rate of Practice Adoption as Related to Valuing Soil Quality
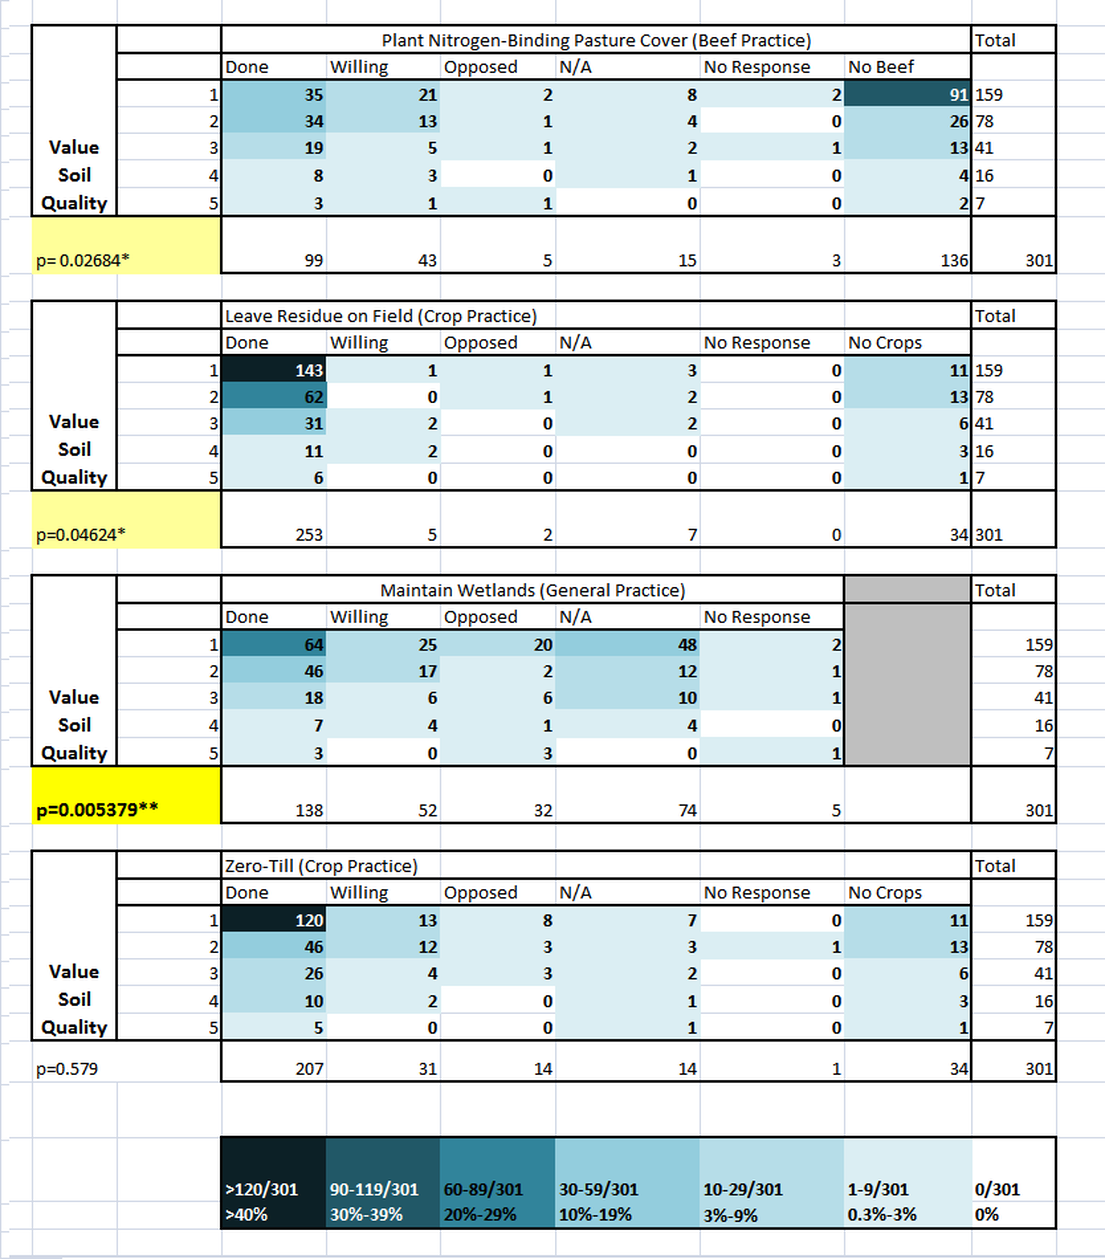
In Table 6, the darkest blue cells represent the highest proportion of responses - these high concentrations occur under Leave Residue on Field and Zero-Till.
Graph 7 - Rate of Practice Adoption as Related to Valuing Soil Quality